在本章中,我們將學習如何在同一畫布上創建多個子圖。
subplot()函數返回給定網格位置的axes對象。此函數的簽名是 -
plt.subplot(subplot(nrows, ncols, index)
在當前圖中,該函數創建並返回一個Axes對象,在ncolsaxes的nrows網格的位置索引處。索引從1到nrows * ncols,以行主順序遞增。如果nrows,ncols和index都小於10。索引也可以作為單個,連接,三個數字給出。
例如,subplot(2, 3, 3)和subplot(233)都在當前圖形的右上角創建一個軸,佔據圖形高度的一半和圖形寬度的三分之一。
創建子圖將刪除任何與其重疊的預先存在的子圖,而不是共用邊界。
參考以下示例代碼:
#! /usr/bin/env python
#coding=utf-8
import matplotlib.pyplot as plt
# 顯示中文設置...
plt.rcParams['font.sans-serif'] = ['SimHei'] # 步驟一(替換sans-serif字體)
plt.rcParams['axes.unicode_minus'] = False # 步驟二(解決坐標軸負數的負號顯示問題)原文出自【許虎虎】,商業轉載請聯繫作者獲得授權,非商業請保留原文鏈接
# plot a line, implicitly creating a subplot(111)
plt.plot([1,2,3])
# now create a subplot which represents the top plot of a grid with 2 rows and 1 column.
#Since this subplot will overlap the first, the plot (and its axes) previously created, will be removed
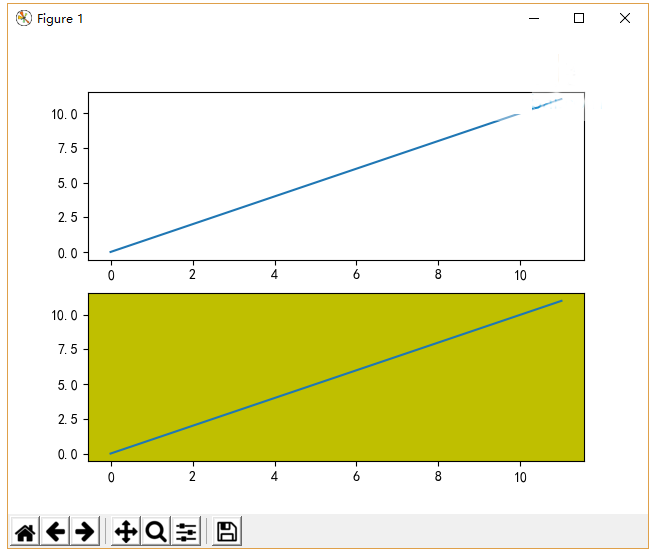
plt.subplot(211)
plt.plot(range(12))
plt.subplot(212, facecolor='y') # creates 2nd subplot with yellow background
plt.plot(range(12))
plt.show()
執行上面示例代碼,得到以下結果:
figure類的add_subplot()函數不會覆蓋現有的圖,參考以下代碼 -
#! /usr/bin/env python
#coding=utf-8

import matplotlib.pyplot as plt

# 顯示中文設置...
plt.rcParams['font.sans-serif'] = ['SimHei'] # 步驟一(替換sans-serif字體)
plt.rcParams['axes.unicode_minus'] = False   # 步驟二(解決坐標軸負數的負號顯示問題)

fig = plt.figure()
ax1 = fig.add_subplot(111)
ax1.plot([1,2,3])
ax2 = fig.add_subplot(221, facecolor='y')
ax2.plot([1,2,3])
plt.show()
執行上面示例代碼,得到以下結果:
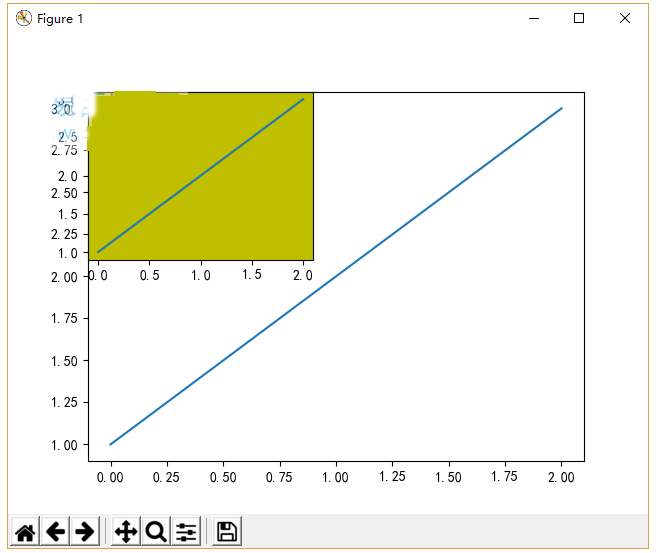
可以通過在同一圖形畫布中添加另一個軸對象來在同一圖中添加插入圖。參考以下實現代碼 -
#! /usr/bin/env python
#coding=utf-8
import matplotlib.pyplot as plt
import numpy as np
import math

# 顯示中文設置...
plt.rcParams['font.sans-serif'] = ['SimHei'] # 步驟一(替換sans-serif字體)
plt.rcParams['axes.unicode_minus'] = False   # 步驟二(解決坐標軸負數的負號顯示問題)

x = np.arange(0, math.pi*2, 0.05)
fig=plt.figure()
axes1 = fig.add_axes([0.1, 0.1, 0.8, 0.8]) # main axes
axes2 = fig.add_axes([0.55, 0.55, 0.3, 0.3]) # inset axes
y = np.sin(x)
axes1.plot(x, y, 'b')
axes2.plot(x,np.cos(x),'r')
axes1.set_title('正弦')
axes2.set_title("余弦")
plt.show()
執行上面示例代碼,得到以下結果:
上一篇:
Matplotlib Axes類
下一篇:
Matplotlib subplots()函數