在图中具有双x或y轴有时是很有用的。 此外,当绘制具有不同单位的曲线时。 Matplotlib通过twinx()和twiny()函数支持此功能。
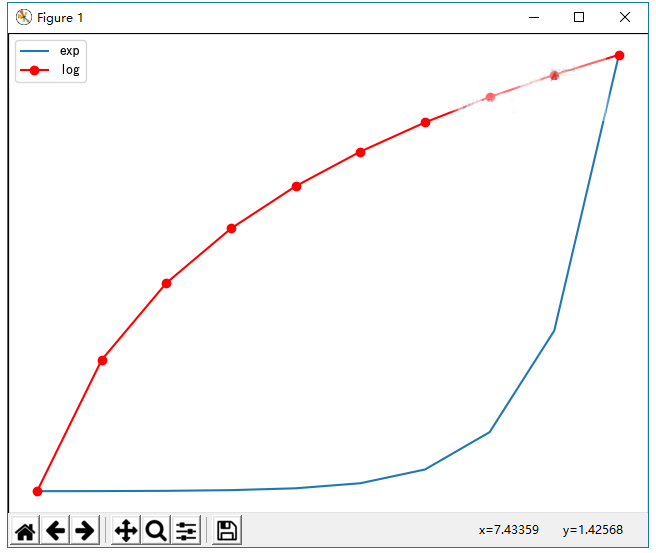
在下面的示例中,绘图具有双y轴,一个显示exp(x),另一个显示log(x) -
#! /usr/bin/env python
#coding=utf-8
import matplotlib.pyplot as plt
import numpy as np
import math

plt.rcParams['font.sans-serif'] = ['SimHei'] # 步骤一(替换sans-serif字体)
plt.rcParams['axes.unicode_minus'] = False   # 原文出自【许虎虎】,商业转载请联系作者获得授权,非商业请保留原文链接:


fig = plt.figure()
a1 = fig.add_axes([0,0,1,1])
x = np.arange(1,11)
a1.plot(x,np.exp(x))
a1.set_ylabel('exp')
a2 = a1.twinx()
a2.plot(x, np.log(x),'ro-')
a2.set_ylabel('log')
fig.legend(labels = ('exp','log'),loc='upper left')
plt.show()
执行上面示例代码,得到以下结果 -
上一篇:
Matplotlib设置刻度和刻度标签
下一篇:
Matplotlib条形图